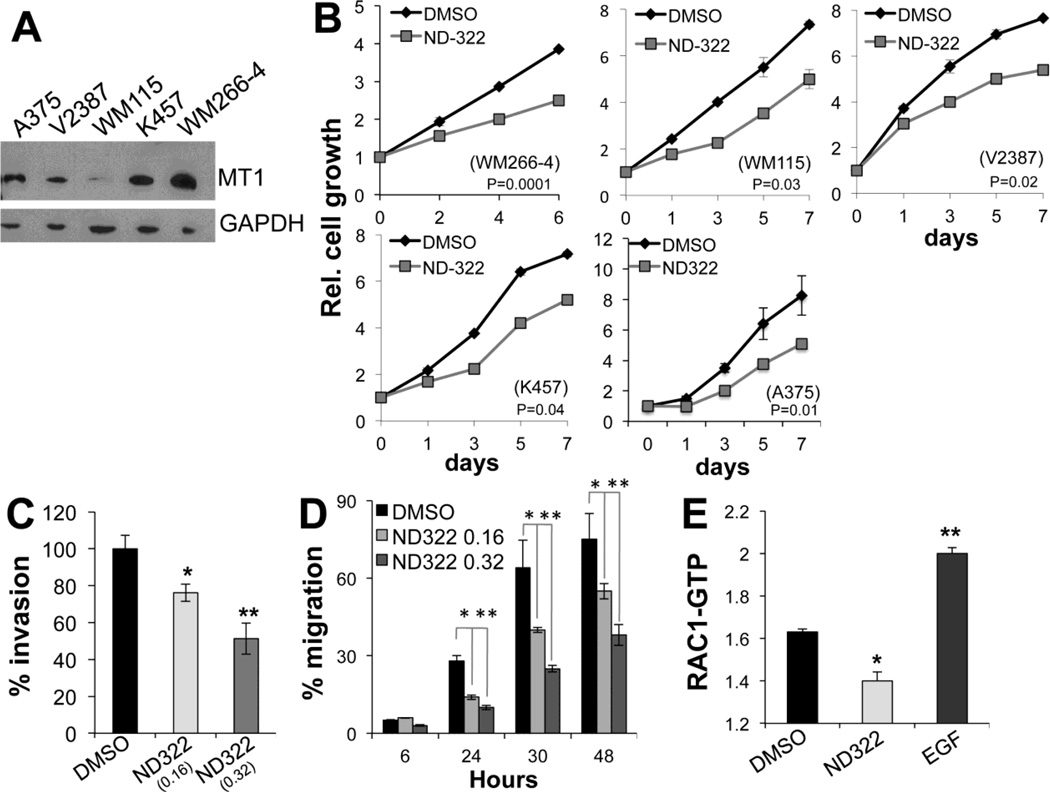
Figure 2. ND-322 inhibits cell growth, migration and invasion.
A Relative cell growth of four melanoma cell lines treated with 0.32 µM ND-322 for the indicated times. Differences in growth are significant at all time points with the exception of day 1 of A375. p values in each figure are relative to the last time point (Student’s t test). B Invasion through matrigel gels of WM266-4 cells treated for 24 hours with ND-322 or DMSO. C Migration of cells treated with two doses of ND-322 for the indicated times. 24 hours: DMSO vs 0.16µM ND-322; p< 0.01; DMSO vs 0.32µM ND-322: p<0.0001; 30 hours: DMSO vs 0.16µM ND-322; p< 0.001; DMSO vs 0.32µM ND-322: p<0.0001; 48 hours: DMSO vs 0.16µM ND-322; p< 0.0001; DMSO vs 0.32µM ND-322: p<0.0001 (Student’s t test). D RAC1 activity of WM266-4 cells treated for 24 hours with ND-322 (0.32 µM). *p=0.004. EGF (10 ng/ml for 3 min) was used as positive control.

