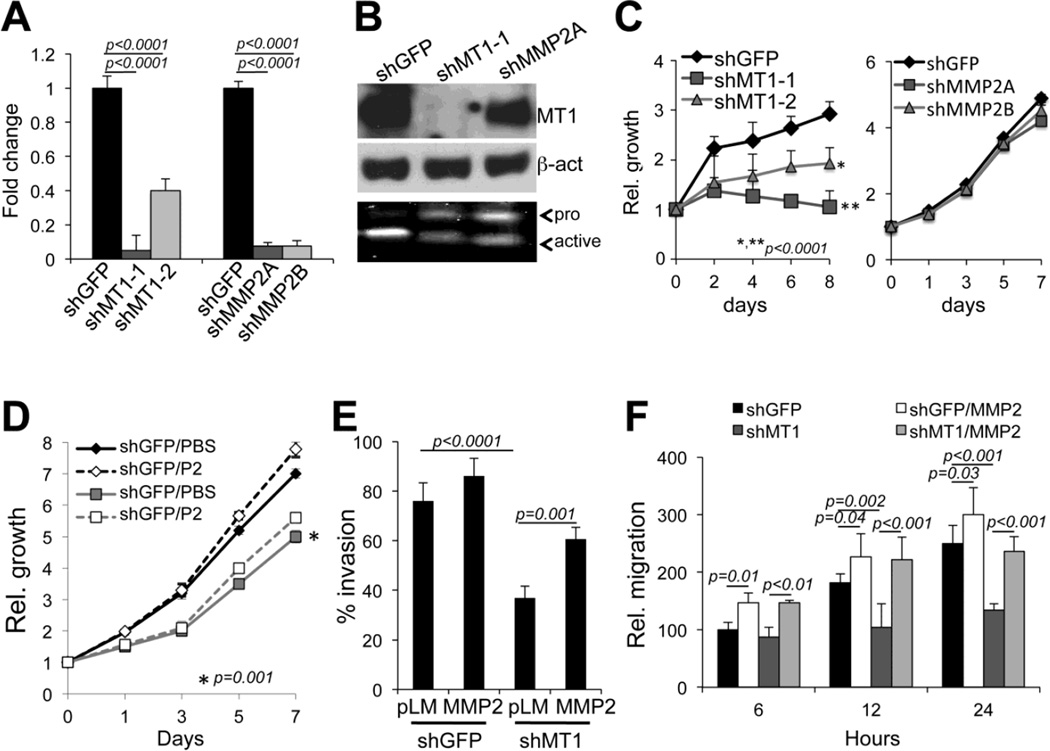
Figure 3. MT1-MMP and MMP2 differentially regulate cell growth, migration and invasion.
A qRT-PCR of MT1-MMP and MMP2 mRNA in WM266-4 cells expressing shGFP, shMT1-MMP (shMT1-1 and shMT1- 2) or shMMP2 (shMMP2A, shMMP2B. B Expression of MT1-MMP and activity of MMP2 (zymogram, bottom panel) of the cells in A (only cells expressing shMT1-1 and shMMP2A are shown). β-actin was used as loading control. C Relative cell growth of WM266-4 cells expressing either shRNAs against MT1- MMP (left panel) or against MMP2 (right panel) versus control cells (shGFP). D Relative cell growth of WM266-4 cells expressing shGFP or shMT1-1 and treated with recombinant MMP2 (P2 - 25ng/ml). *p<0.001, Student’s t test. E Invasion through matrigel gels of WM266-4 cells expressing shGFP or shMT1-1 and treated with recombinant MMP2. F Migration over 24 hours of the cells in D. MMP2 indicates recombinant MMP2 added at 25ng/ml.

