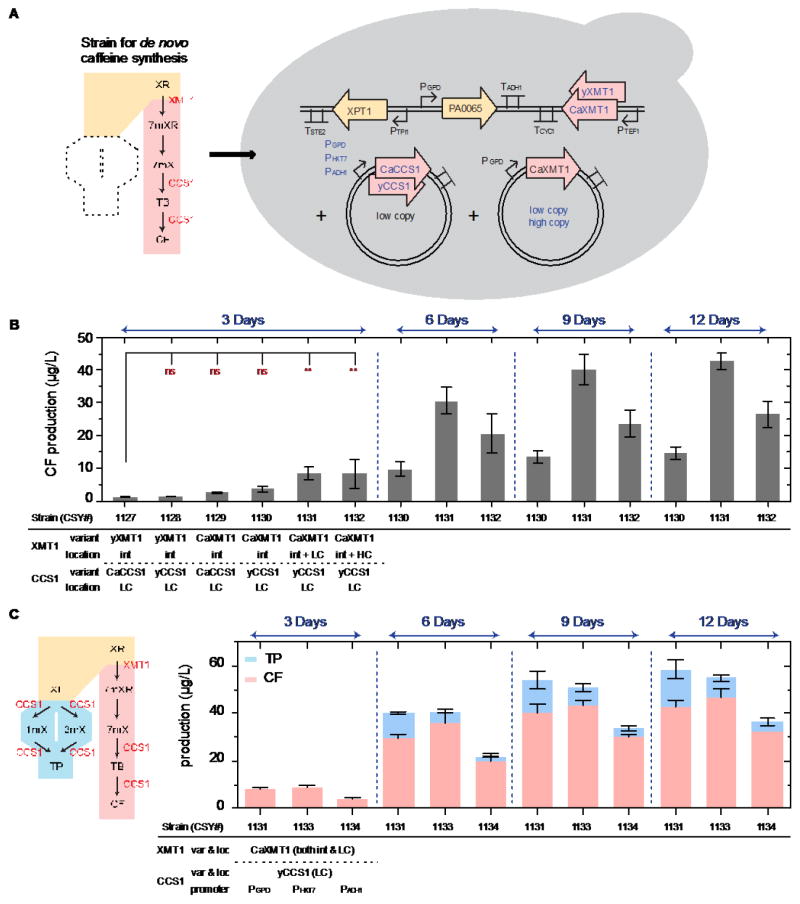
Fig. 3.
(1.5 column) Caffeine production and genetic optimization strategies. (A) The pathway (left) represents the de novo caffeine synthesis route (pink), with an additional enzyme CCS1 (from C. arabica) to convert 7-methylxanthine into caffeine. The schematic yeast cell (right) illustrates the optimization strategies used to improve caffeine titer, including: copy number, yeast-codon optimization, and expression level tuning (in blue font color). (B) DNA copy number and enzyme codon optimization for increased caffeine titer after 3, 6, 9, and 12 days of culture (YNB-DO with 2% dextrose). (C) An alternate route (blue, left) when expressing CCS1 in the engineered S. cerevisiae strains. The plot shows the production of both caffeine and theophylline of each strain with different CCS1 expression levels under the control of three promoters (PGPD, PHXT7, and PADH1) after 3, 6, 9, and 12 days of culture (YNB-DO with 2% dextrose). Production of caffeine and theophylline was analyzed by LC–MS/MS, and data are reported as the mean and standard deviation of biological triplicates. Relevant genetic contents for each strain are displayed below the horizontal bar under each plot (see Table 1 for complete strain information). Abbreviations: int: integrated gene copy, LC: low-copy plasmid. Notations: significance summary: p > 0.05 (ns), p ≤ 0.05 (*), p ≤ 0.01 (**), p ≤ 0.001 (***), and p ≤ 0.0001 (****).

