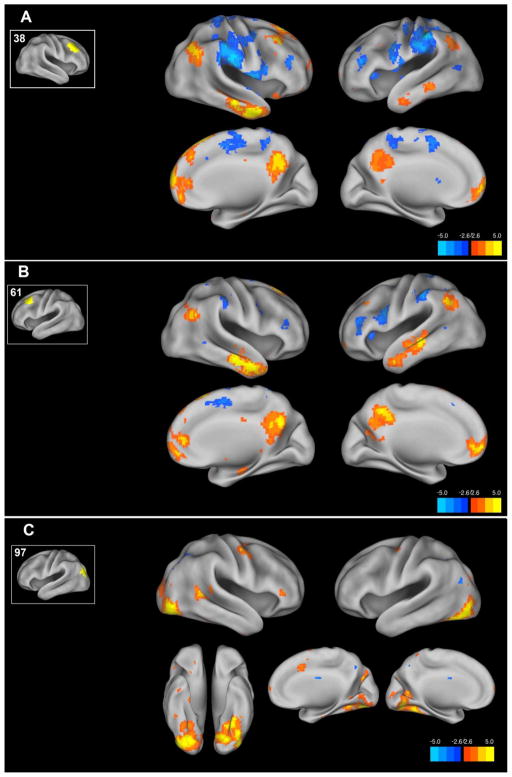
Figure 2. ROI to voxel maps of functional connectivity differences between the healthy comparison and bipolar euthymia groups.
Using ROIs identified in the ROI to ROI connectivity analysis we examined whole brain functional connectivity differences between the healthy comparison and bipolar euthymia groups. The resulting maps of the healthy comparison-bipolar euthymia contrast are shown projected onto the cortical surface. For each figure A–C the inset shows the ROI number and the ROI location on the cortical surface. Voxels here are thresholded at the voxel P<.005 level. Color Bar indicates T statistic.

