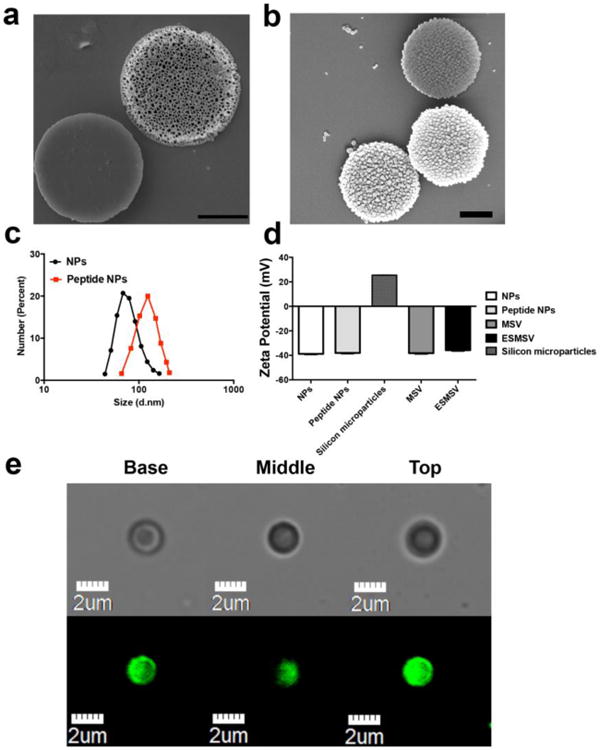
Fig. 2.

Characterization of the ESMSV. a-b) Scanning electron microscopy (SEM) images of the front and back sides of MSVs (a) and ESMSVS (b). Scale bar, 1 μm. c) Size distribution of NPs and peptide (MMP2 substrate)-NPs obtained with dynamic light scattering. d) Zeta potential of NPs, peptide-NPs, silicon microparticles, MSVs, and ESMSVs. Results are presented as mean ± SD of three measurements. e) Confocal laser scanning microscopy images. Columns from left to right show the basal, middle, and top planes of the ESMSV. The upper row was captured in the bright field channel and the lower row in the FITC channel (coumarin 6).
