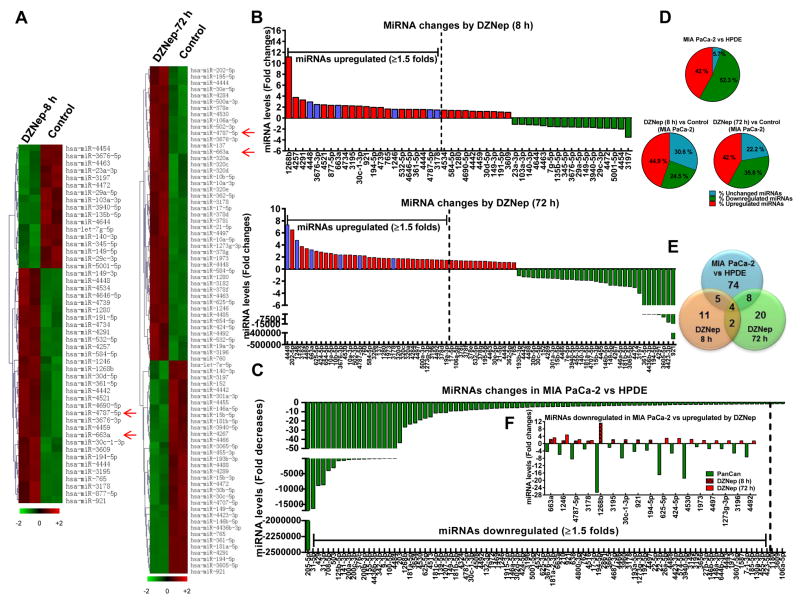
Figure 3. DZNep reprograms PDAC-downregulated miRNAs in pancreatic cancer.
A. Clustering of miRNAs differentially expressed in DZNep (1 μM)-treated MIA PaCa-2 versus untreated. Heat maps with statistically significant (p<0.1) changes in miRNA expression shown by a 2-color system (light green, lowest expression; dark red, highest expression). Each row represents expression of a single miRNA while each column represents a single sample. n=2. B. Fold changes in miRNAs after 8 h or 72 h of DZNep treatment in MIA PaCa-2. Purple bars indicate miRNAs upregulated by DZNep at both time points. C. MiRNAs downregulated in MIA PaCa-2 compared against HPDE. D. Pie charts showing expression patterns of miRNAs. A fold change of ≥ or ≤1.5 considered as upregulated or downregulated respectively. E. Venn diagram comparing miRNAs downregulated in MIA PaCa-2 against HPDE (blue; n=2) with those upregulated by DZNep in MIA PaCa-2 at 8 h (orange) or 72 h (green). F. Fold changes of miRNAs downregulated in MIA PaCa-2 (Pan Can) but upregulated after DZNep treatment.

