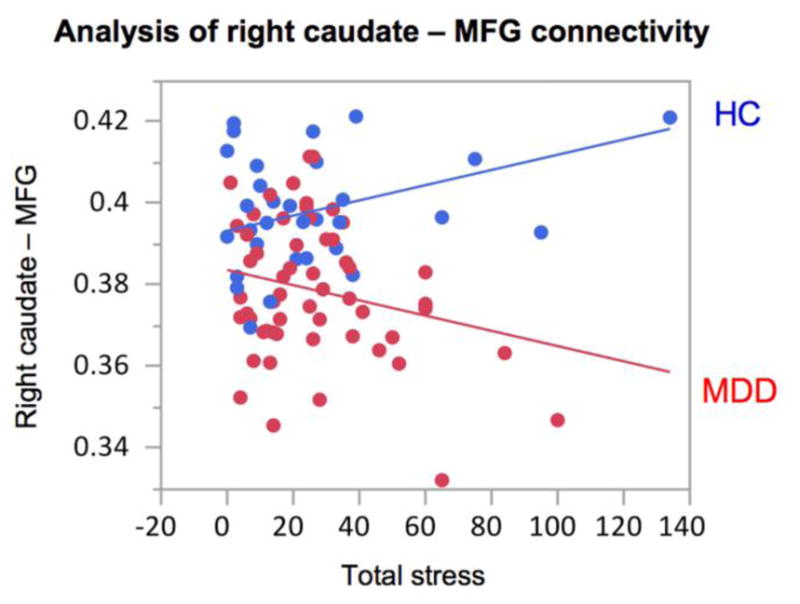
Figure 4.

GLM analysis of the FA-based connectivity between the right caudate and middle frontal gyrus (MFG) with diagnosis and diagnosis × total stress as covariates (the latter resulting in p=0.0080). Bivariate analysis with stress in MDD subjects resulted in a negative correlation, r=−0.3217, p=0.0156. Bivariate analysis with stress in healthy subjects resulted in a non-significant positive trend, r=0.2561, p=0.1643.
