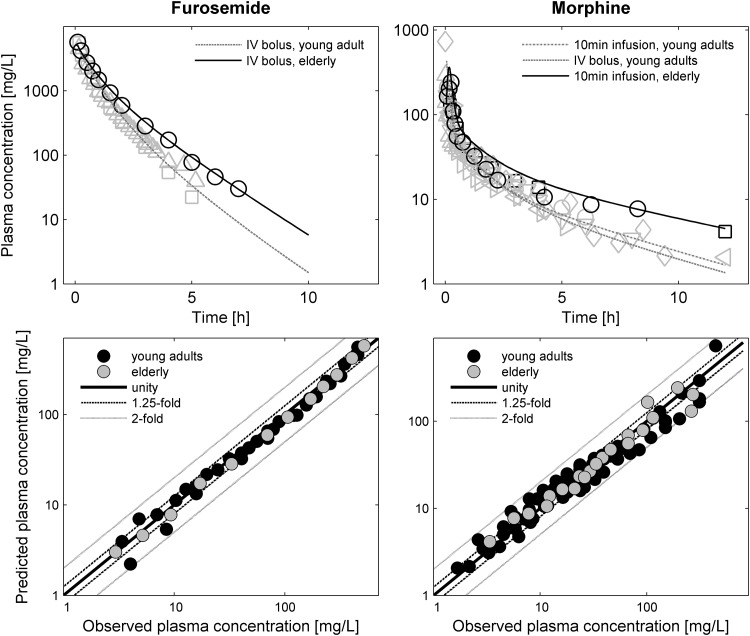
Fig. 6.
Upper panel: predicted mean plasma concentration–time profiles of furosemide and morphine in younger adults (grey dashed line) versus the elderly (black line). The concentrations are normalized to a 40 mg dose for furosemide and to a 10 mg dose for morphine. Observed data are superimposed (black open symbols represent values for the elderly [130, 134, 137]; grey open symbols represent values for younger adults [129, 130, 133, 136–138, 141, 142]). Lower panel: goodness-of-fit plots for furosemide and morphine model predictions in the adult population (black dots) and the elderly population (grey dots). A solid line represents the line of identity; dashed lines represent the 1.25-fold error range and dotted lines represent the 2-fold error range

