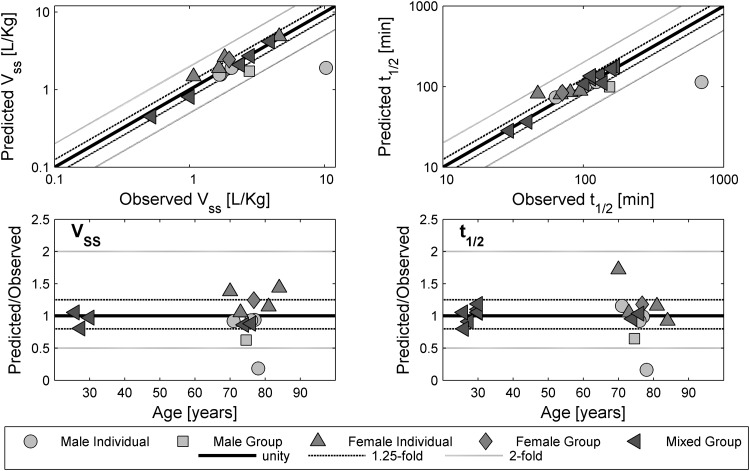
Fig. 8.
Observed versus predicted values for the volume of distribution at steady state (V ss) and elimination half-life (t ½), as well as the corresponding fold over-/underprediction, for the test compound morphine. A solid line represents the line of unity; dashed black lines represent the 1.25-fold level and grey lines represent the 2-fold level of the predicted accuracy

