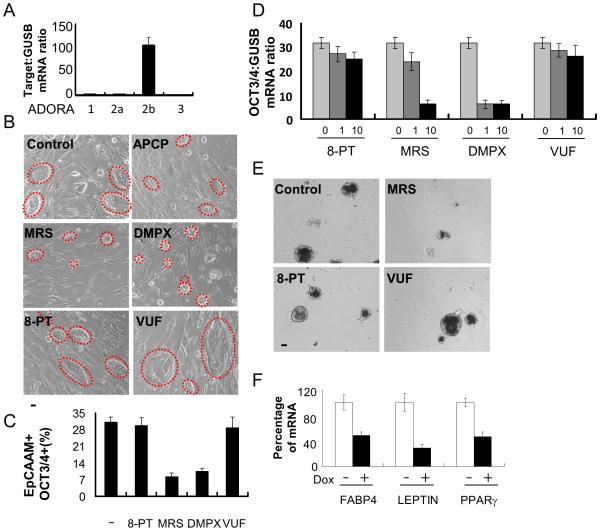
Fig. 3. ADORA2b receptor signaling mediates adenosine functions in ePS cells.
ePS cells from RM136 and RM142, grown in F-FM (panels A, D and F) or on feeders (panels B, C and E), were assessed for A. ADORA1, ADORA2a, ADORA2b and ADORA3 transcript expression by qRT-PCR (n=3 each); B. size and morphology of ePS colonies (outlined with red dashed lines) treated or not with APCP and/or adenosine receptor-specific inhibitors (8-PT, MRS, DMPX or VUF; 10μm) for 7 days (n=2 each). Data from RM136 are shown. Scale bars: 10μm.; C. EpCAM+ OCT3/4+ cell fractions by FACS analysis. (n=2 each); D. OCT3/4 transcript expression by qRT-PCR in ePS cells treated or not with 8-PT, MRS, DMPX and VUF for 48 h (n=3 and n=6, respectively); E. generation of embryoid bodies treated or not with 8-PT, MRS and VUF for 7 days (n=2). Scale bars: 10μm.; F. adipogenesis at 14 days in ePS cells transduced with or without shADORA2b and induced or not with Doxycycline. Comparison of transcript expression of adipogenic differentiation markers FABP4, LEPTIN and PPARγ by qRT-PCR (n=3 each). Panels B and E show data from RM136.

