
Figure 2.
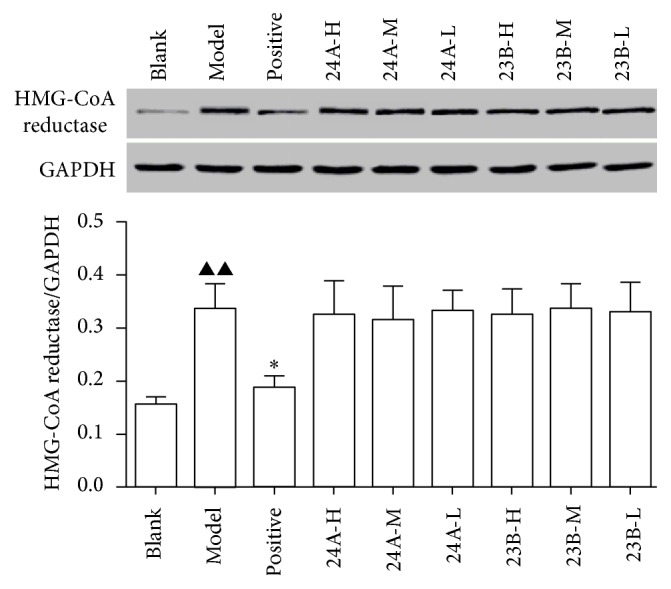
Results of the protein expression of HMG-CoA reductase in mice liver tissue protein (n = 11). Note: compared to the blank group, ▲▲ P < 0.01 and ▲ P < 0.05; compared to the model group, ∗∗ P < 0.01 and ∗ P < 0.05; 24A-H: alisol A 24-acetate high, 24A-M: alisol A 24-acetate medium, and 24A-L: alisol A 24-acetate low; 23B-H: alisol B 23-acetate high, 23B-M: alisol B 23-acetate medium, and 23B-L: alisol B 24-acetate low.