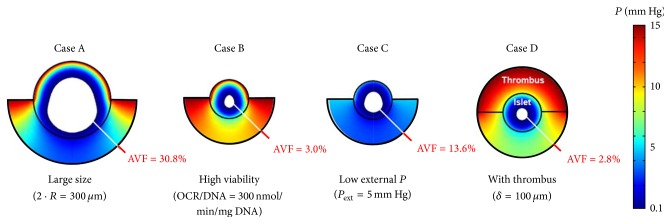
Figure 3.
Surface plots illustrating model results for four different cases in which the Baseline Case (no thrombus, OCR/DNA = 200 nmol/min/mg DNA, P ext = 15 mm Hg, and 2 · R = 150-μm) is perturbed by adjusting only 1 of the 4 parameters with each case. Case A depicts the Baseline Case with an increase in the islet diameter from 150 to 300 μm. Case B depicts the Baseline Case with an increase in the OCR/DNA from 200 to 300 nmol/min/mg DNA. Case C depicts the Baseline Case with a decrease in P ext from 15 to 5 mm Hg. Case D depicts the Baseline Case with the addition of a 100 μm thrombus on the proximal half-surface of the islet. The anoxic volume fraction (AVF) is depicted by the achromatic core. Note the magnitude of the AVF associated with each perturbation. AVF, anoxic volume fraction; OCR, oxygen consumption rate; P, oxygen partial pressure; P ext, external blood P; R, islet radius.

