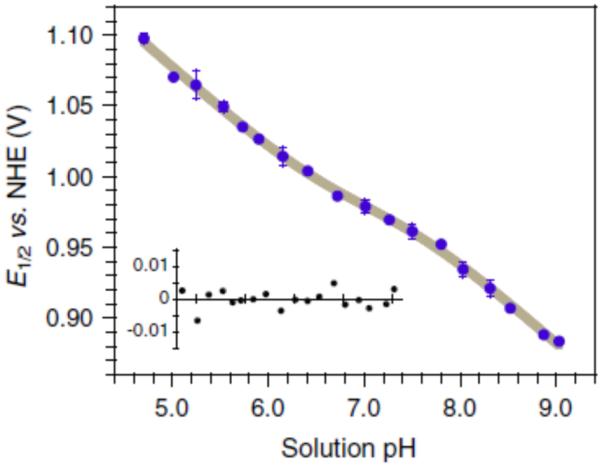
Figure 20.

A Pourbaix diagram for reversible oxidation of a tyrosine residue in the α3Y protein; the gray line is a non-linear regression featuring a slope of 59 ± 5 mV. Reprinted with permission from Figure reprinted with permission from Proc. Nat. Acad. Sci. [154].
