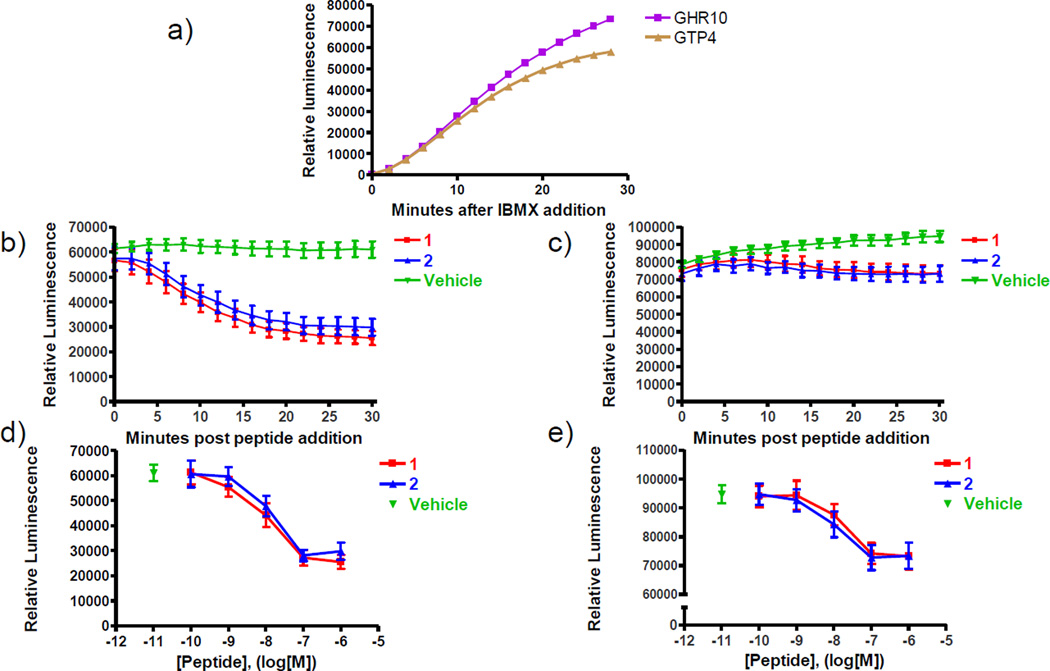
Figure 4. Inverse agonism activity of peptides at constitutively active PTHR1 mutants.
Cells were incubated in CO2 independent media containing D-luciferin (0.5 M) and 3-isobutyl-1-methylxanthine (IBMX, 2 mM) for 30 minutes before addition of inverse agonist peptides (panel a). These experiments were performed in HEK-293 cells transfected to stably express either hPTHR1 T410P (GTP4 cell-line, panels b and d) or H223R (GHR10 cell line, panels c and e) variants. The time courses presented in panels b and c represent alterations in intracellular cAMP levels stimulated following addition of peptides at a final dose of 1 µM. Dose response plots presented in panels d and e represent relative luminescence levels recorded 30 minutes after addition of inverse agonist peptides or vehicle. The y-axis in panel e is presented using a discontinuity to highlight the dose response relationship observed. Data are presented as means (± SEM) of three experiments, with each condition assessed in duplicate in each experiment.

