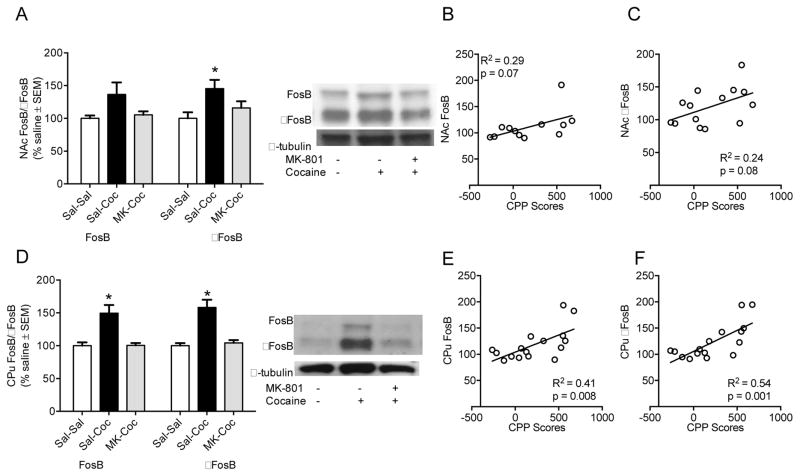
Figure 5.
(A) NAc FosB (left 3 bars, top band: 48 kDa) and ΔFosB (right 3 bars, bottom band: 38 kDa) protein levels and (B & C) correlation to CPP scores (FosB:B and ΔFosB:C). (D) CPu FosB (left 3 bars, top band: 48 kDa) and ΔFosB (right 3 bars, bottom band: 38 kDa) protein levels and (E & F) correlation to CPP scores (FosB:E and ΔFosB:F). Protein levels are expressed as a ratio to their respective α tubulin levels (55 kDa) (±SEM) (n = 6 animals per group). *Significant difference at p <0 .05.

