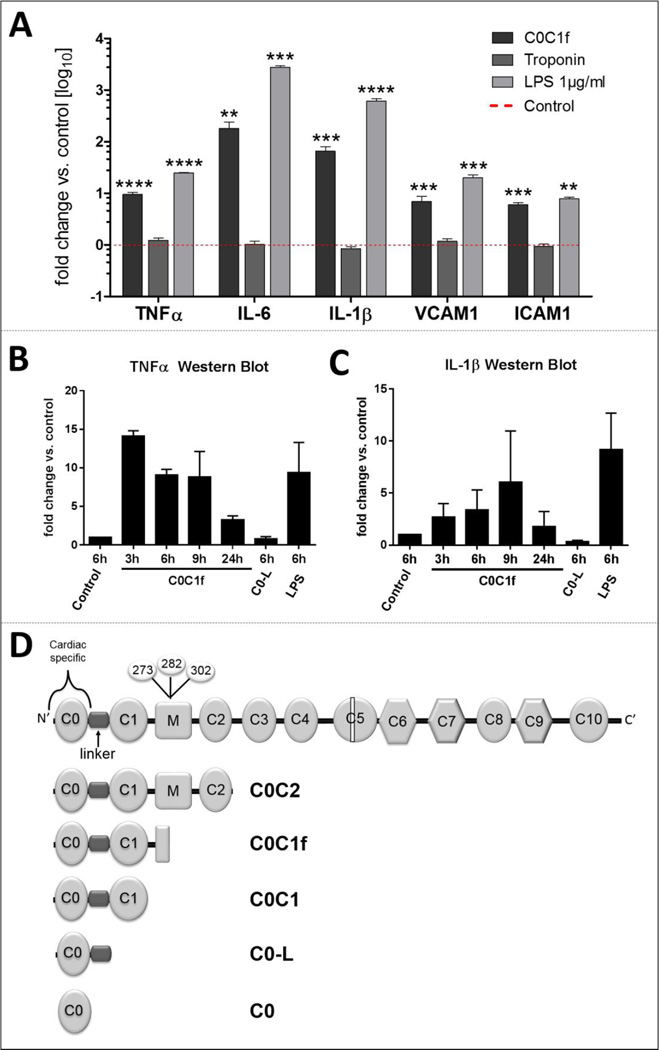
Figure 1. Initiation of inflammatory responses by MI biomarkers.
Murine macrophages were treated with 500 ng/ml C0C1f, 500 ng/ml cTnI, or 1µg/ml LPS for 6 hours. Thereafter, mRNA was isolated and mRNA levels of TNFα, IL-6, IL-1β, VCAM1, and ICAM1 were measured by qRT-PCR. Mean ± SEM; Statistical analysis was performed using Kruskal-Wallis one-way ANOVA with Dunn’s post-hoc test, n.s. non-significant, ** p<0.005, *** p<0.0005, **** p<0.0001 (n=13 for cTnI, n=31 for C0C1f and n=4 for LPS). b–c) Murine macrophages were treated for the indicated lengths of time with 500 ng/ml C0C1f and for 6 h with C0-L or LPS. Western blot analysis was used for determination of protein levels of b) IL-1β and c) TNFα. Depicted is the mean ± SEM of n=3 individual experiments. Statistical analysis was performed using the Mann Whitney U test, comparing each sample individually with control (p>0.07). d) Structure of cardiac MyBP-C. Calpain-dependent cleavage takes place in the M-domain. Various N-terminal fragments were designed.

