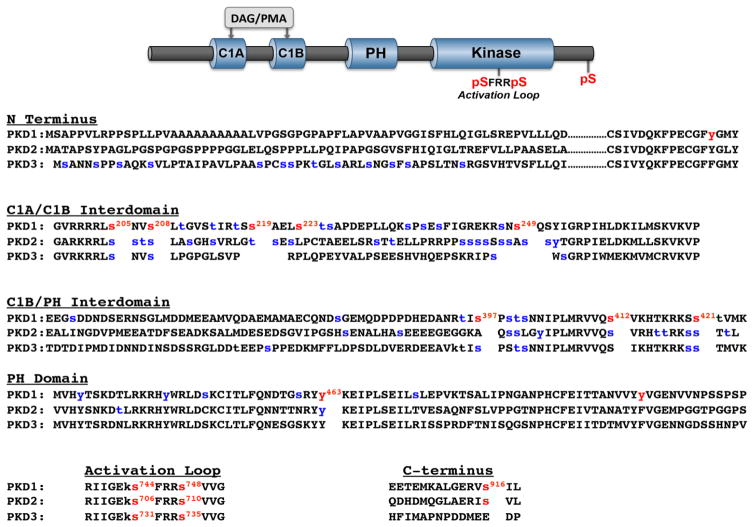
Figure 1. Domain structure and phosphorylation sites on PKD1, PKD2, and PKD3.
Top: The cartoon depicts the common domain structure of PKD isoforms with conserved C1A-C1B and PH domains in the regulatory region, the kinase domain in the catalytic region, the activation loop phosphorylation motif (conserved in all there PKD isoforms), and the C-terminal phosphorylation site (conserved in PKD1 and PKD2, but not PKD3). Bottom: Sequence alignments for PKD isoform the N-termini, C1A-C1B interdomains, C1B-PH interdomains, PH domains, activation loops and C-termini, with phosphorylation sites at the activation loop, the C-terminus, and other sites that have been the focus of studies in the literature in red. Phosphorylation sites identified in high throughput phosphoproteomic studies (curated by Phosphosite [15]) are depicted in blue.

