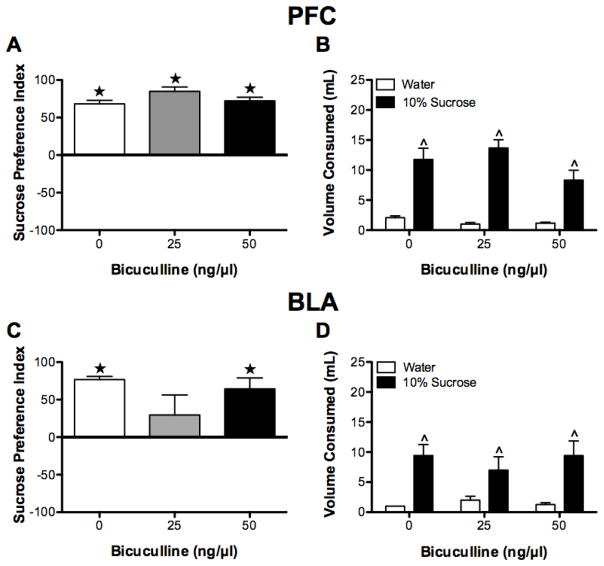
Figure 6.
Sucrose intake test. With one exception (intra-BLA BMI 25 ng), all rats exhibited a preference for sucrose as indicated by a sucrose preference score that was significantly greater than 0 (A, C). Furthermore, regardless of condition, all rats consumed significantly more 10% sucrose than water (B, D). ★P < 0.05, relative to a sucrose preference index of 0. ^P < 0.05, relative to water.

