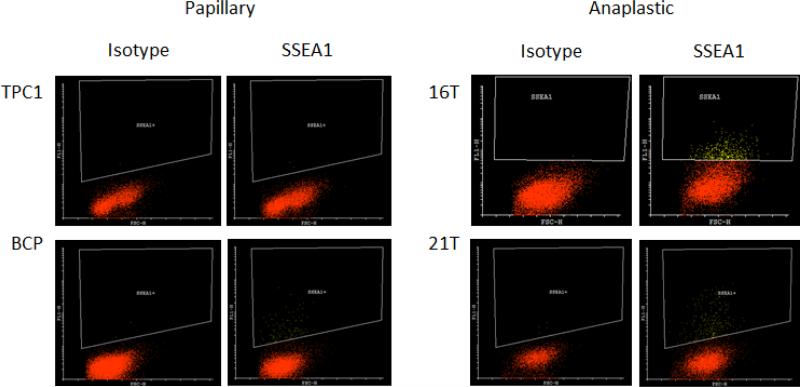
Figure 6.
Flow cytometric analysis of SSEA-1 content in two papillary (TPC1 and BCP) and two anaplastic (16T and 21T) thyroid carcinoma cell lines. The TPC and BCP papillary lines had little or no SSEA1 expression (0.1% and 1% respectively), whereas, the THJ-16T and THJ- 21T anaplastic cells lines expressed a significantly higher levels of SSEA1 as indicated by yellow dots (5.4% and 2.8% respectively). The isotypic immunoglobulin was used as the negative control for each cell line.

