
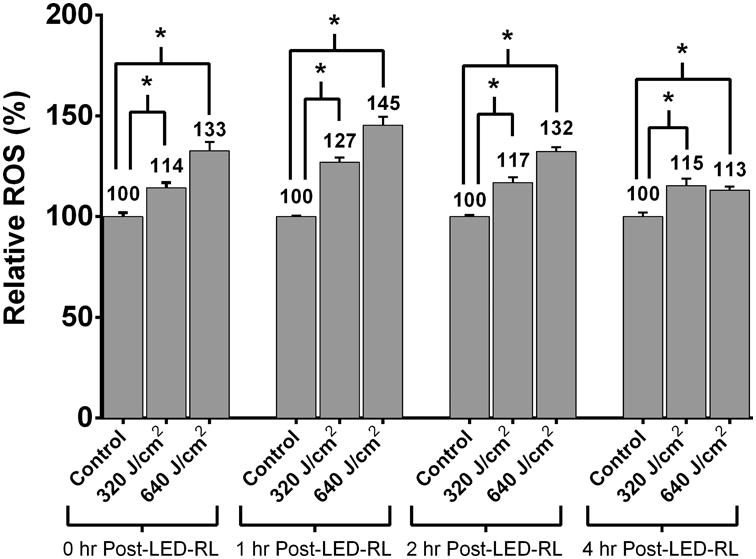
Figure 2.
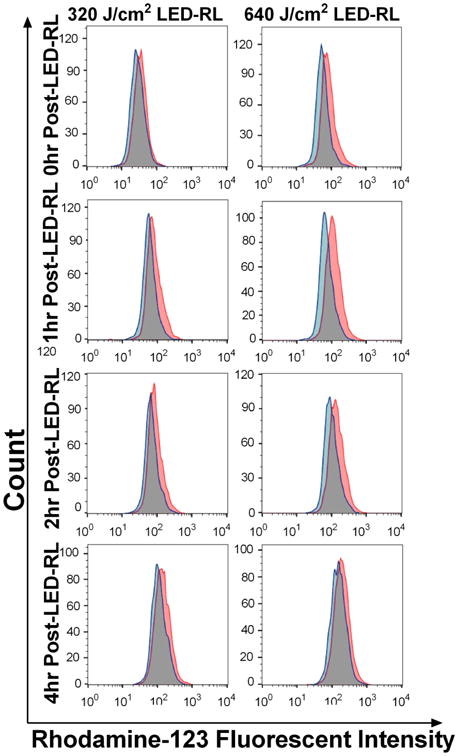
HDFs treated with 320 and 640 J/cm2 LED-RL demonstrate significantly increased ROS levels compared to matched controls for up to 4 hours post-irradiation. (a) Representative flow cytometry curves. Red curves represent mean fluorescent intensity of HDFs treated with HF-LED-RL, blue curves represent matched controls.
(b) At 0, 1, 2, and 4 hours following irradiation, ROS levels were significantly elevated compared to matched controls. Peak ROS levels were observed 1 hour following 320 and 640 J/cm2 LED-RL and found to be 127% (p=0.0026) and 145% (p=0.0018) relative to matched controls, respectively. Data are representative of three repeat experiments in two different HDF strains. Similar temporal results were obtained in the two strains examined. Error bars represent mean ± SEM; *P<0.05