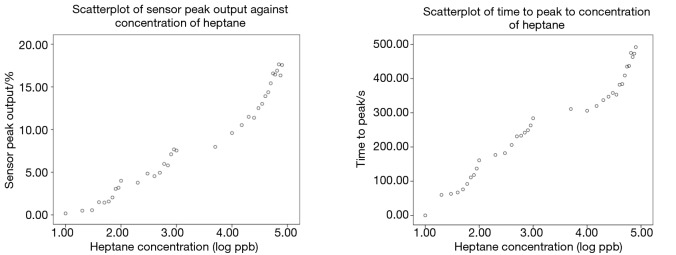
Figure 2.
Scatterplots of sensor peak output (left) and time to peak (right) against concentrations of heptane in logarithm scale. There is a positive and linear correlation between the peak output as well as the time to peak and the concentration of heptane. The curves at the top right of both the scatterplots indicate that the sensor was at close proximity to sensor poisoning as the concentration of the heptane vapour was beyond their range of detection, which was between 20 ppb to 80 ppm.

