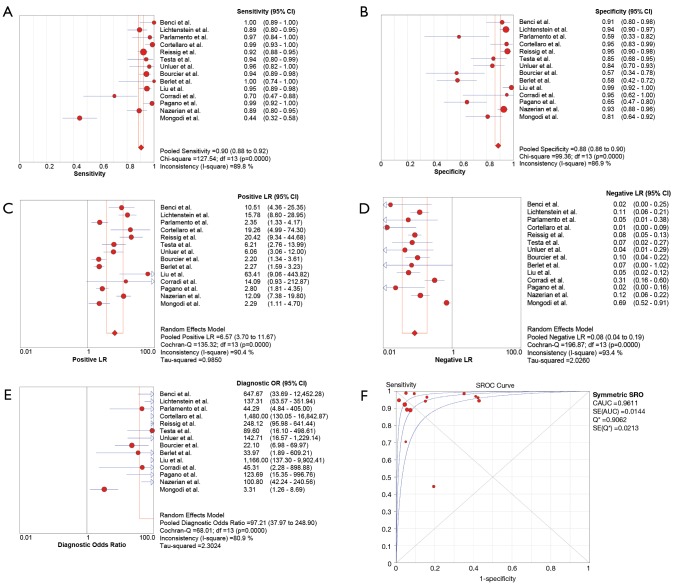
Figure 2.
Forest plots for diagnostic accuracy of lung ultrasound on the diagnosis of pneumonia. Sensitivity (A), specificity (B), negative likelihood ratio (C), positive likelihood ratio (D), diagnosis odds ratio (E) and summary receiver operative curves (F). Inconsistency (I2) describes the percentage heterogeneity across studies that are not due to chance.

