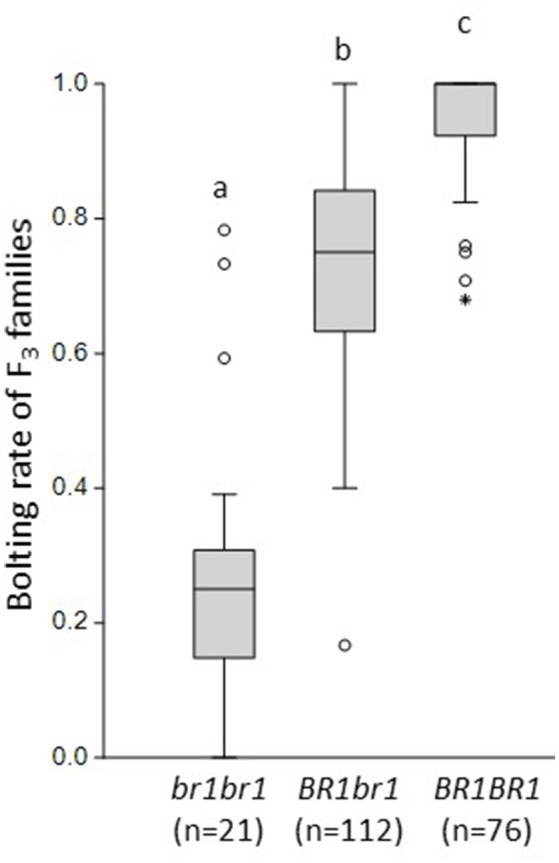
Figure 3.

Bolting rates of F3 families grouped by the BR1 genotypes of their F2 parents. Marker CAU3903 was used for genotyping. The mean bolting rates of F3 families differed significantly between all BR1 genotypes. Statistical analysis is based on Tukey's pairwise test with α = 0.05. The letters a, b, c indicate significant differences.
