
FIGURE 6.
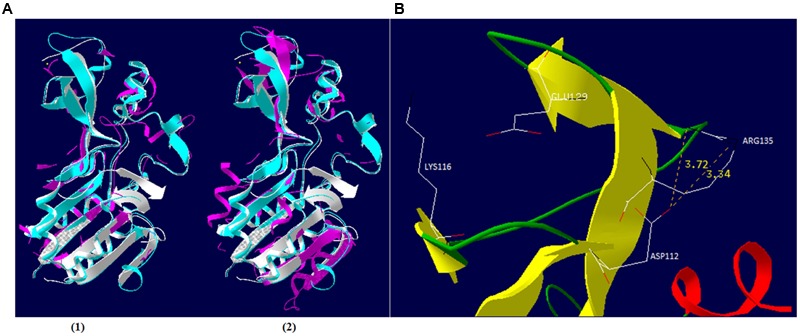
Schematic representation of φSt2 and φGrn1 Sir2/cobB protein. (A) Similar (1) and dissimilar (2) amino acid residues of Sir2/cobB protein of φSt2 (magenta) are shown as superposition of structural models, with Sir2/cobB protein of V. alginolyticus (turquoise). Protein of E. coli is also shown (white). Ligand zinc of the finger domain is also represented (yellow sphere). (B) Ribbon diagram represents the finger domain of Sir2/cobB protein. Sheets (yellow), helices (red), and coils (green) are highlighted. Carbon (white), nitrogen (black), and oxygen (red) of the putative salt bridge residues are shown (represented as sticks). Distances between atoms are shown with yellow numbers (Armstrong).