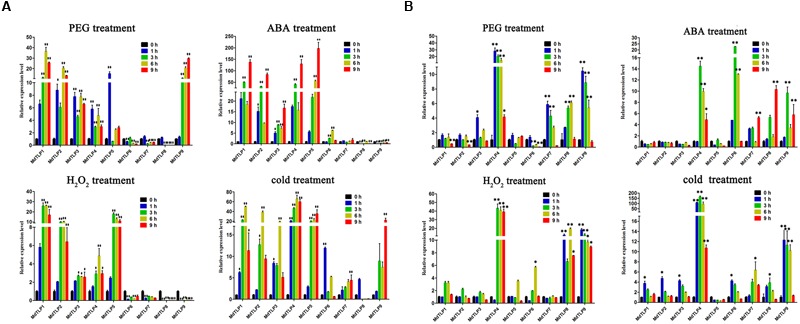
FIGURE 5.

Quantitative real-time PCR (qRT-PCR) for apple under PEG, H2O2, ABA or cold stress and exposure to 20 % PEG6000, 100 mM H2O2, and 100 μM ABA at 4°C for 0, 1, 3, 6, and 9 h. Data were normalized to the expression level of actin gene. The mean expression value was calculated from three independent replicates. Vertical bars indicate the standard error of the mean. ∗∗P ≤ 0.01 and ∗P ≤ 0.05 compared with 0 h. (A) The expression levels of nine MdTLPs in apple leaves under different treatments. (B) The expression levels of nine MdTLPs in apple roots under different treatments.
