
FIGURE 1.
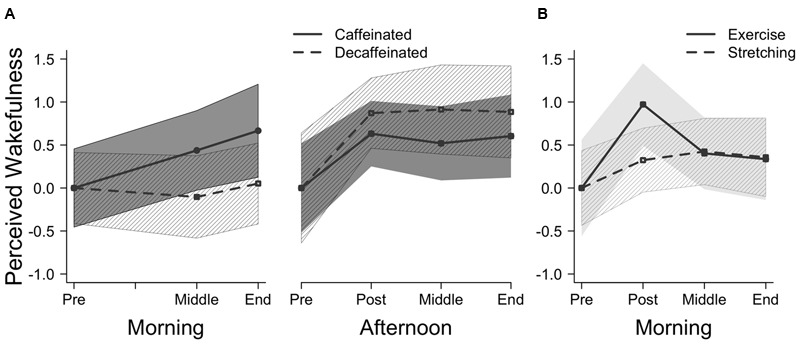
Change in perceived wakefulness across different points in Experiment 1 (A) and Experiment 2 (B). Perceived wakefulness ratings are presented as z-scores to compare across experiments with 95% confidence bands. After the data were transformed to z-scores, each participant’s baseline perceived wakefulness rating was subtracted from their rating at each time point to illustrate their change in wakefulness across the experiment.