
FIGURE 2.
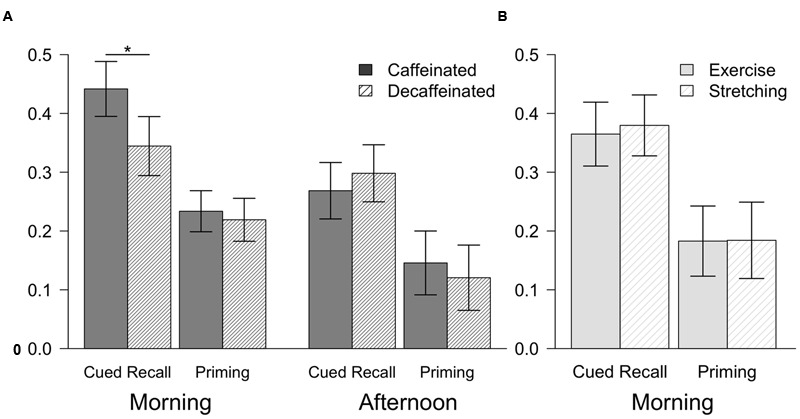
Mean performance for cued recall and priming for Experiment 1 (A) and Experiment 2 (B). Cued recall was measured as the percentage of study words correctly recalled. Priming scores were calculated by subtracting normative baseline completion rates (Ryan et al., 2001) from the percentage of stems completed with the words from the study phase. Error bars show the 95% confidence intervals. ∗p < 0.05.