
Figure 4.
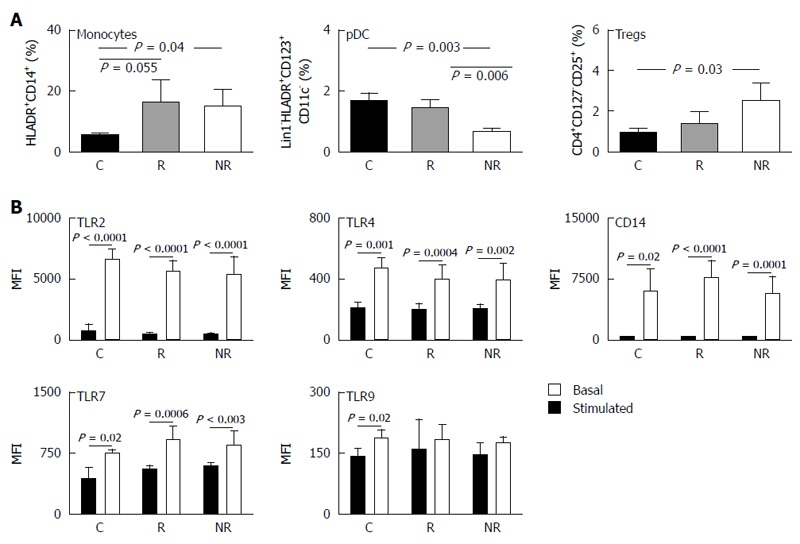
Peripheral blood mononuclear cells phenotype and toll-like receptor /CD14 protein levels in responders and non-responders compared to healthy controls. A: Percentage of monocytes, pDC and CD4+ regulatory T cells were determined from total population of PBMCs isolated from responders (R, n = 12), non-responders (NR, n = 12) and healthy controls (C, n = 12) by FACS analysis. Data are expressed as mean percentage (± SD) of total cell population; B: Basal (black columns) and stimulated (white columns) TLR2, TLR4, TLR7, TLR9 and CD14 protein levels in PBMCs isolated from C (n =12), R (n =12) and NR (n = 12) were assessed by surface and intracellular staining followed by FACS analysis. Data are expressed as mean fluorescence intensity (MFI ± SD). The P values represent statistical significance of < 0.05 between the groups as denoted. PBMC: Peripheral blood mononuclear cells; TLR: Toll-like receptor; pDC: Plasmacytoid dendritic cells.