
Figure 5.
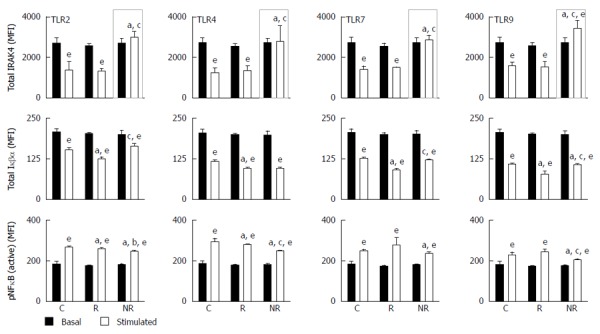
Basal and stimulated toll-like receptor signalling pathways in responders and non-responders compared to healthy controls. PBMCs isolated from responders (R, n = 12), non-responders (NR, n = 12) and healthy controls (C, n = 12) were stimulated with TLR2, TLR4, TLR7 or TLR9 agonists for 24-48 h prior to intracellular staining for total IRAK4 (top), total Iκβα (middle) and phosphorylated (activated) NFκB (pNFκβ) (bottom) followed by FACS analysis. Data are expressed as MFI ± SD. aP < 0.05 vs stimulated healthy control C (white open bars); cP < 0.05 compared to stimulated responders (white open bars); eP < 0.05 compared to basal (black solid bars). Grey open boxes represent differences in total IRAK4 expression compared to responders and controls. PBMC: Peripheral blood mononuclear cells; TLR: Toll-like receptor; NFκB: Nuclear factor kappa B; Iκβα: Inhibitor of NFκB.