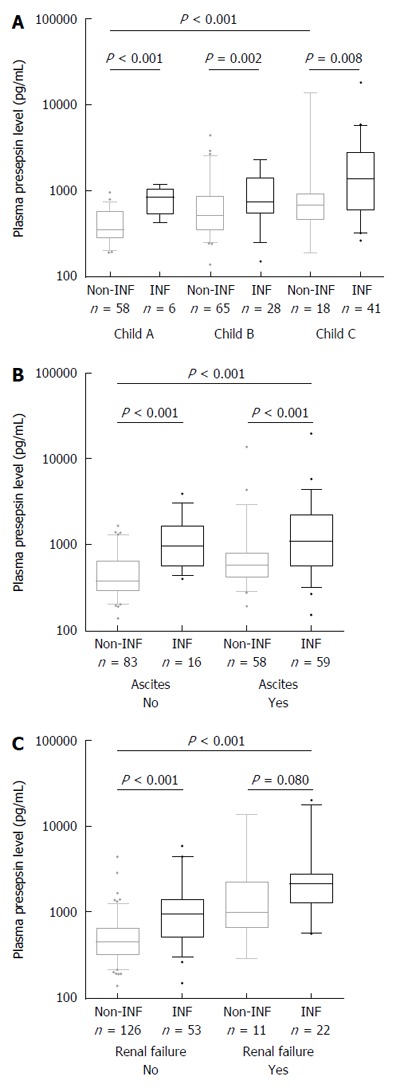
Figure 2.

Presepsin levels in subgroups of patients with different diseases severity according to presence or absence of bacterial infections (n = 216). Significant differences in median presepsin levels between non-infected and infected patients are observed in all disease severity subgroups according to Child-Pugh stage (A) or the presence of ascites (B); However, no significant difference is observed in renal failure subgroup (C). Among non-infected patients, a significant increase in median presepsin levels is observed according to disease severity or in the presence of renal failure. Lines denote median values, boxes represent 25th-75th percentiles and whiskers indicate the 5th-95th range. P values were calculated by the Mann-Whitney U or the Kruskal-Wallis H-test as appropriate. Creatinine values of 4 patients were missing in the non-infected group.
