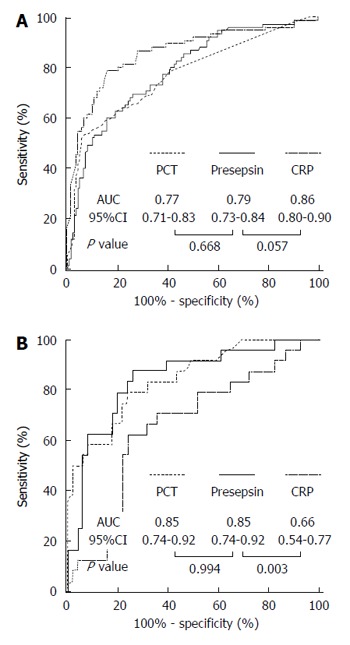
Figure 3.

Receiver-operating characteristic curves of presepsin, procalcitonin and C-reactive protein for the identification of bacterial infection overall (A) or bacterial infection complicated by organ failure (B). ROC analysis were performed (A) in the whole cohort (n = 216) or (B) in patients with bacterial infection (n = 75). The control group comprised (A) patients without bacterial infection (n = 141), or (B) patients with bacterial infection without organ failure (n = 51). AUC: Area under curve; CI: Confidence interval; CRP: C-reactive protein; PCT: Procalcitonin.
