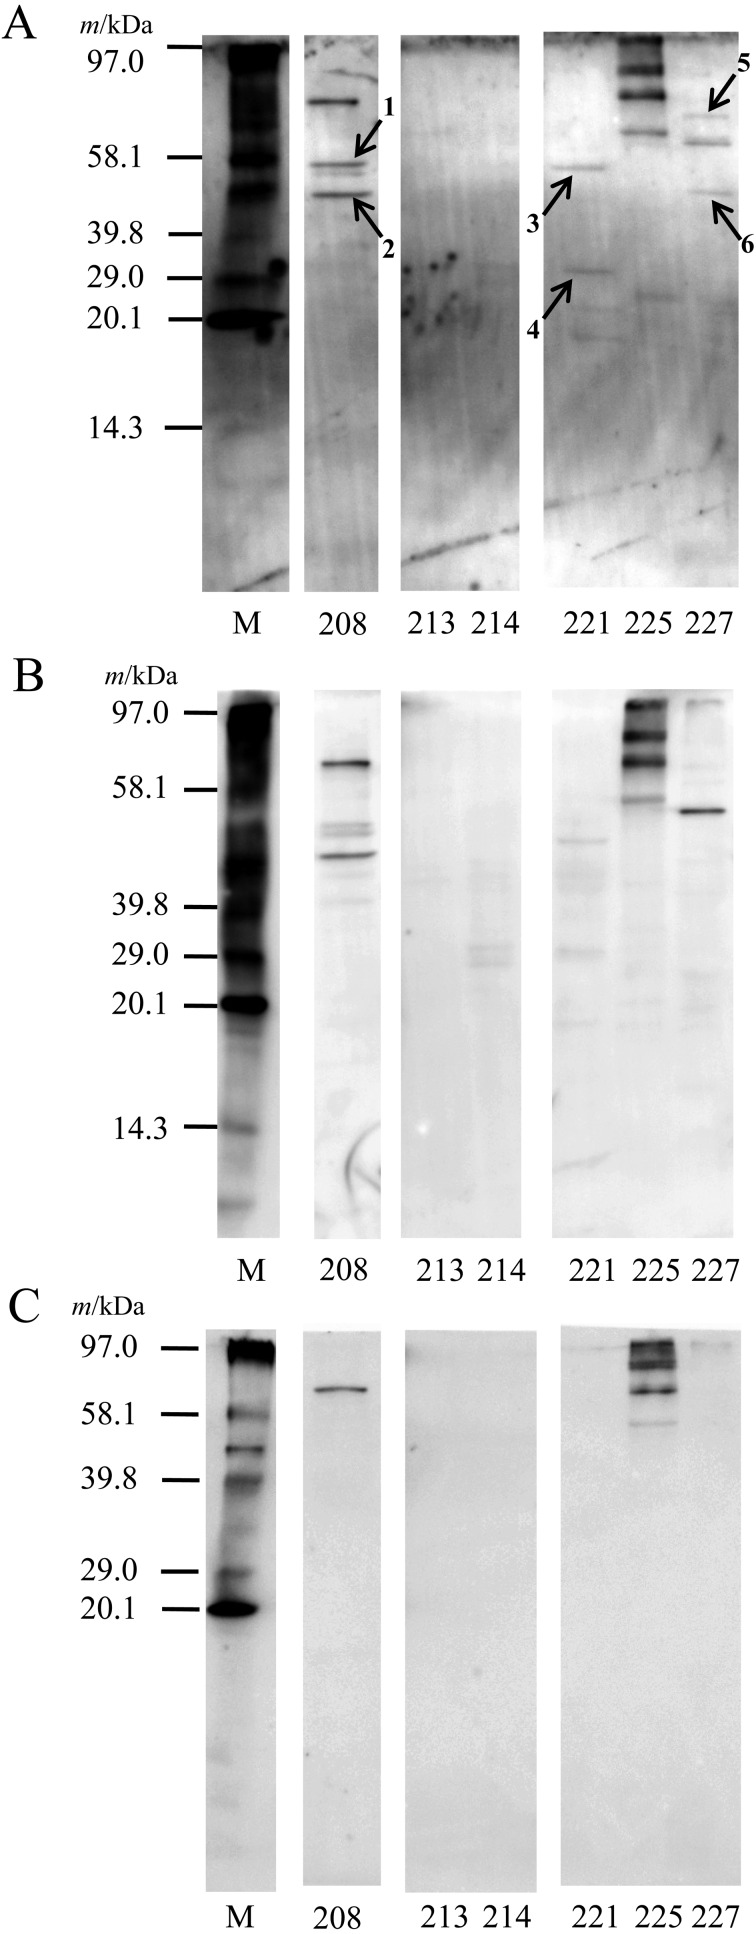
Fig. 3.
Detection of adhesins in PBS extracts by a receptor overlay (RO) analysis.
After SDS-PAGE using 1 mg/ml PBS extracts, proteins were electrophoretically transferred to a PVDF membrane. The membrane was blocked with 5% skim milk. After washing, the membrane was soaked in TBS-T containing the biotinylated PIM (A), BSA (control protein) (B), or only TBS-T buffer (negative control) (C) overnight. After washing, protein bands were visualized using ExtrAvidin Alkaline Phosphatase Conjugate and ECF substrate with a luminescent image analyzer (excitation, 440 nm; emission, 560 nm). M: biotinylated molecular weight marker. The numbers (shows arrows) indicate proteins that were identified (Table 2).

