Figure 3.

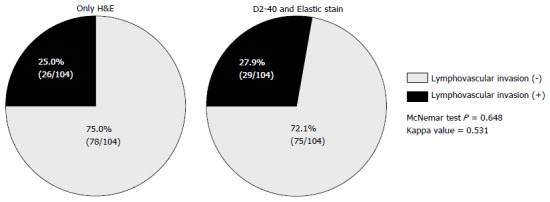
Comparison of pie charts of detected frequencies of lymphovascular invasion between only hematoxylin and eosin histology and acillary stains of D2-40 or Elastica van Gieson stain. H&E: Hematoxylin and eosin.

Comparison of pie charts of detected frequencies of lymphovascular invasion between only hematoxylin and eosin histology and acillary stains of D2-40 or Elastica van Gieson stain. H&E: Hematoxylin and eosin.