
Figure 4.
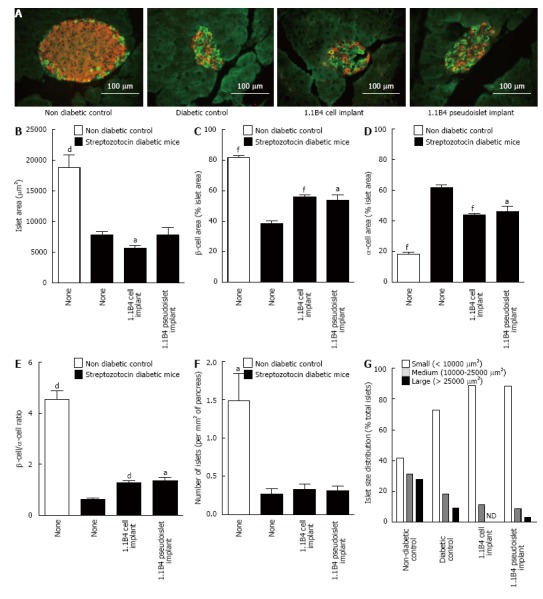
Result of insulin (red) and glucagon (green) staining in islets of non-diabetic and diabetic severe combined immunodeficient mice with or without cell/pseudoislet transplantation. Representative images are shown in A. Islet area (B), β cell area (C), α cell area (D), β to α cell ratio (E), number of islets (F), and islet size distribution (G) were all determined by quantitative histological analysis using cell^F software. Values are mean ± SEM (n = 5). aP < 0.05, dP < 0.01 and fP < 0.001 vs diabetic control.