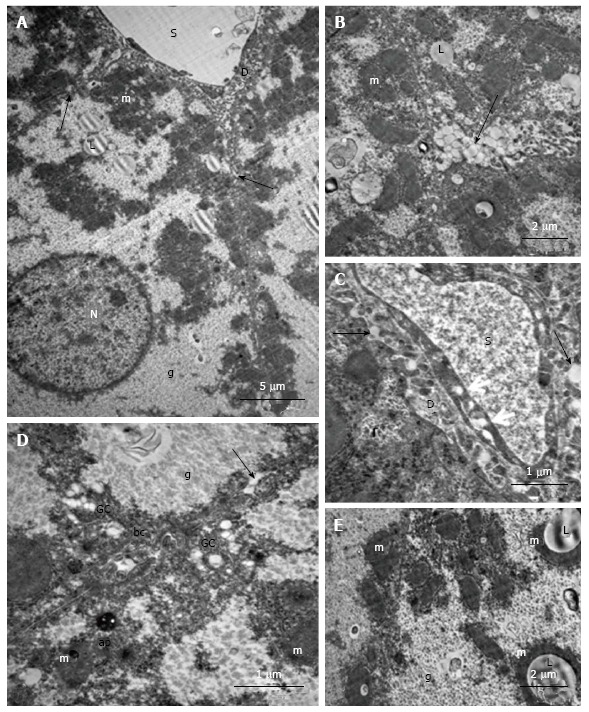
Figure 10.

Ultrastructural changes in the hepatocytes of placebo-treated db/db mice. A: Fatty degeneration, numerous compartments of mito-ER-complexes, free ribosomes and polysomes, pronounced hyperplasia of the microvilli on the vascular poles and lateral sites of parenchymal cells, enlarged Disse spaces; the arrows indicate the extension between the lateral surfaces of adjacent hepatocytes; B: Hyperplasia of microvilli on the lateral parts of the hepatocytes and transport of lipid inclusions (arrow) into spaces between hepatocytes; C: The transport of lipid inclusions into Disse spaces (arrows), transport vacuoles into the cytoplasm of endothelial sinusoidal cells; D: Active Golgi complexes, autophagosomes with dark content and ribosomes in peribiliary areas of hepatocytes; the arrow shows the transport of lipid inclusions into the gap between hepatocytes; E: Structural complexes of lipid inclusions with mitochondria. ap: Autophagosome; g: Glycogen granules; D: The Disse space; bc: Bile capillary; GC: Golgi complex; L: Lipid inclusion; m: Mitochondria; s: Lumen of the sinusoid; e: Erythrocyte; N: The nucleus.
