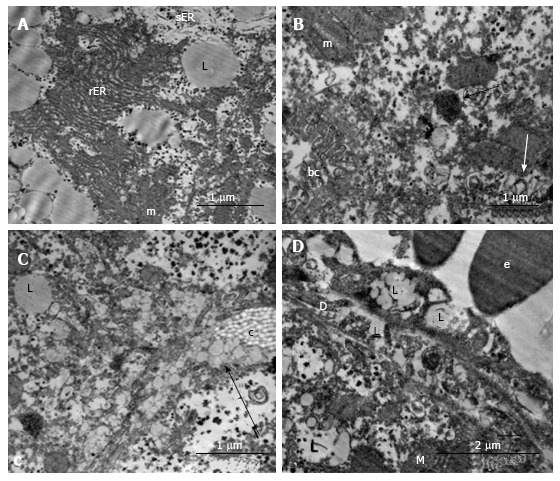
Figure 12.

Ultrastructural changes in the hepatocytes of linagliptin-treated db/db mice. A: The complexes from the mitochondria, rough ER and lipid droplets; B: Mitochondria with separate granular ER profiles, myelin structures (white arrow), autophagosomes with electrondark content and ribosomes (black arrow) nearby the bile capillaries with pronounced microvilli; C: The transport of lipids into the gaps between hepatocytes (arrow); D: Large vacuoles in the cytoplasm of endothelial cells in the sinusoids. rER: Rough endoplasmic reticulum; sER: Smooth endoplasmic reticulum; bc: Bile capillary; D: The Disse space; c: A tuft of collagen; L: Lipid inclusion; m: Mitochondria; e: Erythrocyte.
