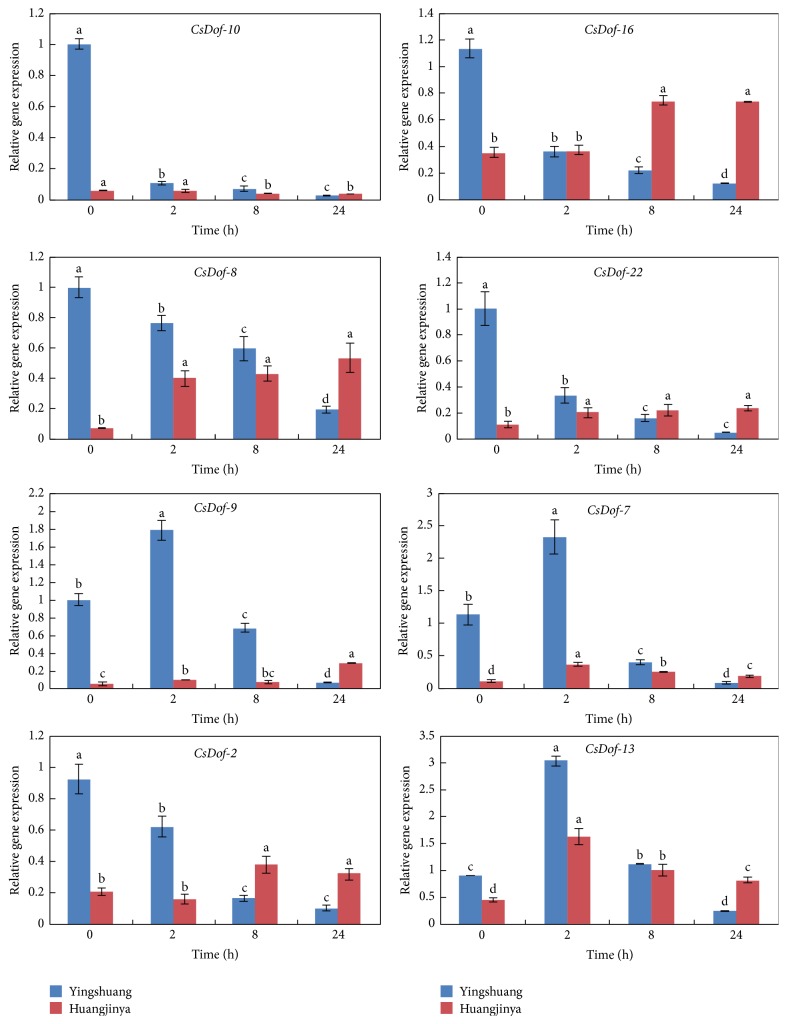
Figure 10.
Expression patterns of CsDof genes in “Yingshuang” and “Huangjinya” under cold temperature stress. Error bars represent standard deviation among three real-time quantitative PCR reaction replicates. Data are means of three technical replicates ± SD. Different lowercase letters indicate significant differences at P < 0.05.

