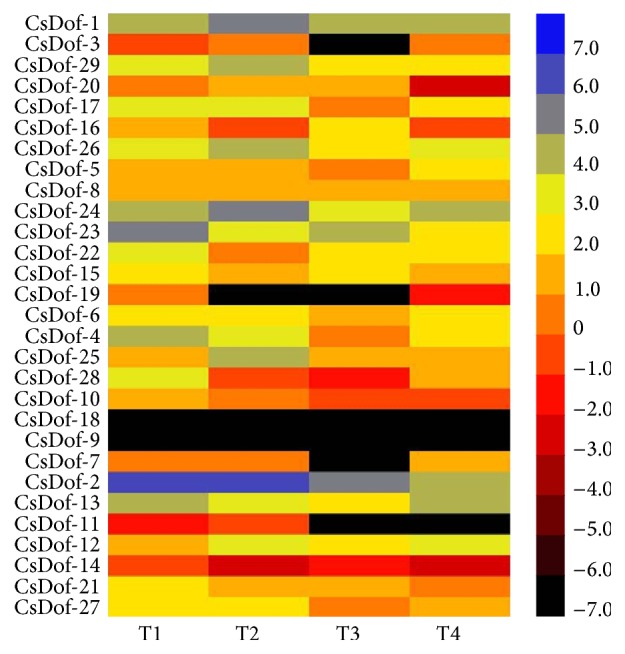
Figure 8.

Heat map of Dof genes in four tea plant cultivars. T1 represents “Yunnanshilixiang,” T2 represents “Chawansanhao,” T3 represents “Ruchengmaoyecha,” and T4 represents “Anjibaicha.” Color scores were normalized by the log2 transformed counts of RPKM values.
