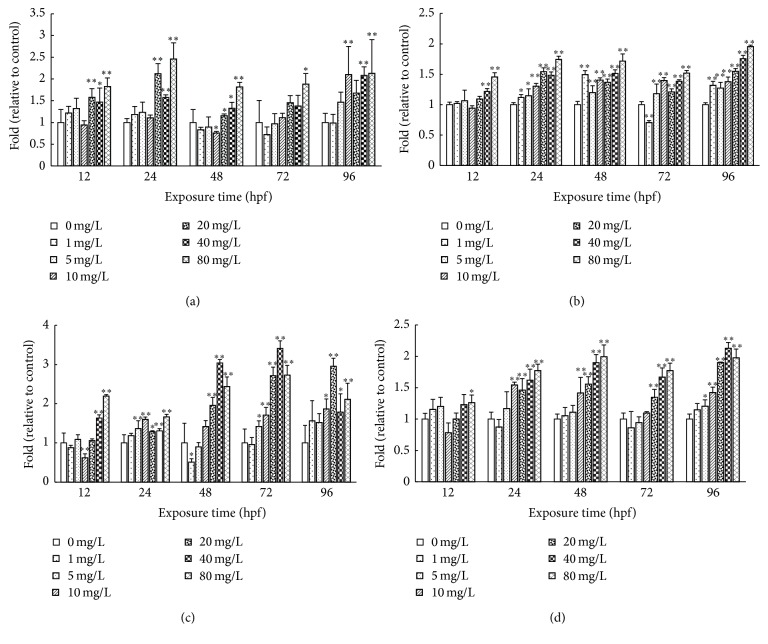
Figure 5.
The SOD, CAT, and GPX activities and MDA contents for rare minnow embryos exposed to different concentration of CDs. The SOD (a), CAT (b), and GPX (c) activities and MDA contents (d) for rare minnow embryos exposed to different concentration of CDs. Values are presented as mean ± SD (n = 20). Values that are significantly different from the control are indicated by asterisks (one-way ANOVA or t-test, ∗ p < 0.05, ∗∗ p < 0.01).

