
Figure 1.
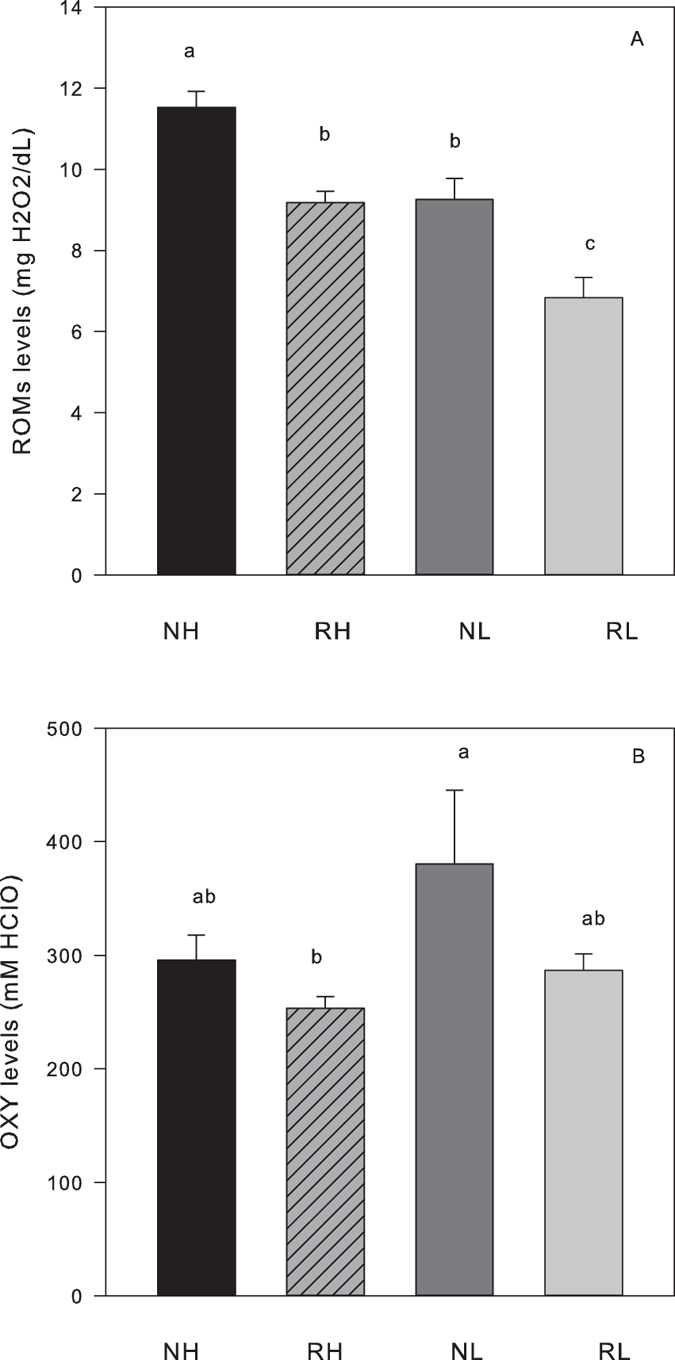
Markers of oxidative stress in the serum of non-reproducing female mice (NH, black bars, N = 10; NL, dark grey bars, N = 10) and reproducing mice at day of weaning (RH, striated bars; N = 20, RL, light grey bars, N = 14) (A) Reactive oxygen metabolites (ROMs). (B) Total non-enzymatic antioxidants capacity (OXY, untransformed data). Different letters inside the bars indicate significant differences between groups.