
Figure 2. Area-specific prevalence of malaria infection by microscopy and PCR on Mfangano and Ringiti Islands.
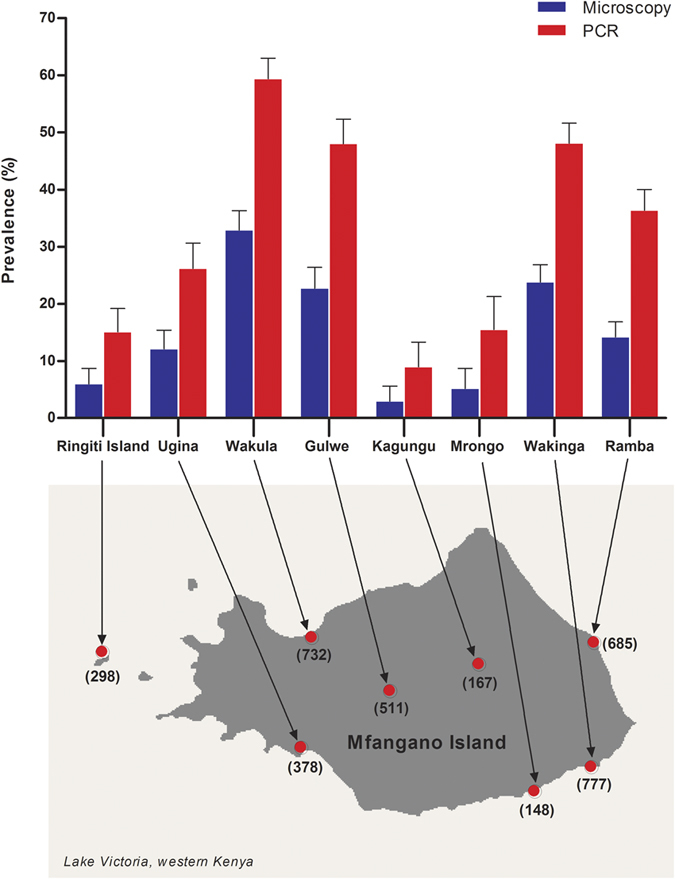
A number in parentheses is the number of overall sample size. Error bars represent 95% confidence intervals. The map was created with ArcGIS software, version 10.4, http://www.esri.com.