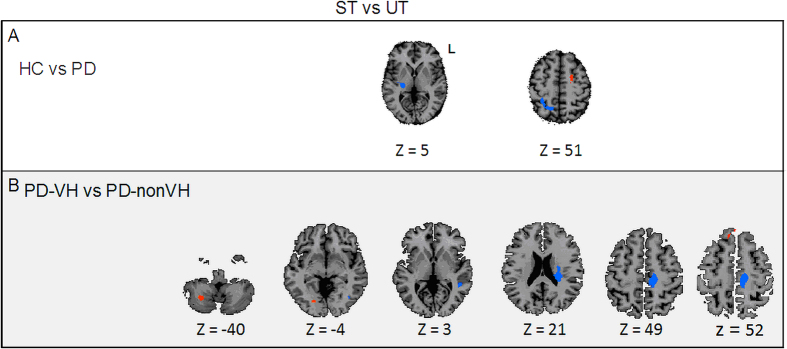
Figure 2. Whole-brain ANCOVA A whole-brain ANCOVA, comparing conscious access to visual inputs in the three groups [t (200) = 2.59, P = 0.01 (corrected at the cluster level)].
Panel A: Comparison of conscious access to visual inputs in the HC vs. PD groups. Panel B: Comparison of conscious access to visual inputs in the PD-VH vs. PD-nonVH groups. ST: seen trials at the threshold, UT: unseen trial at the threshold, PD-nonVH: PD patients without visual hallucinations; PD-VH: PD patients with visual hallucinations; HC: healthy controls; L: left.

