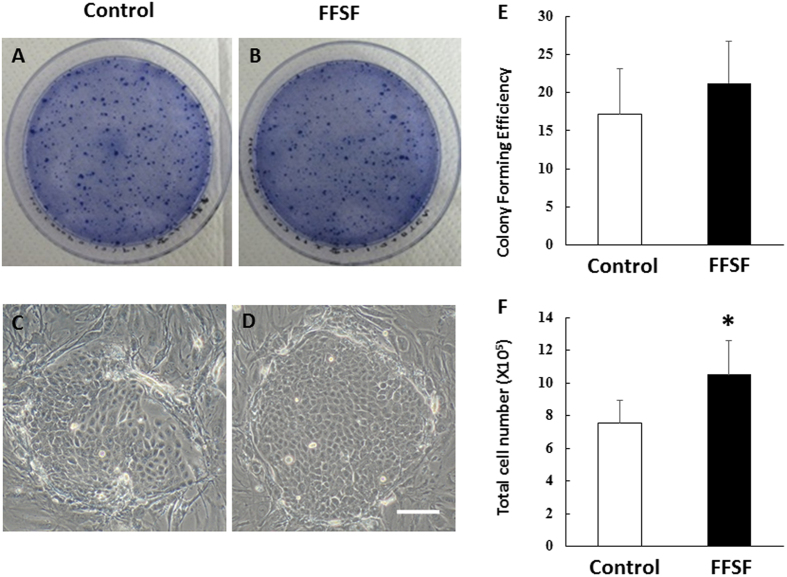
Figure 2.
Representative colony-forming plates and phase contrast inspections of oral mucosal epithelial cells on day 7 of culture in Control (A,C) and FFSF (B,D) culture system. The CFE of FFSF cell conditions tended to be slightly higher than that of Control (21.2 ± 5.5% vs 17.15 ± 5.9%, respectively, N = 4) (E). Total cell number of FFSF cultivated oral mucosal epithelial cell sheet (COMECS) was increasing as compared to Control COMECS (10.5 ± 2.4 × 10⁵ vs 7.5 ± 1.6 × 10⁵, respectively, N = 4, *p < 0.05) (F).

