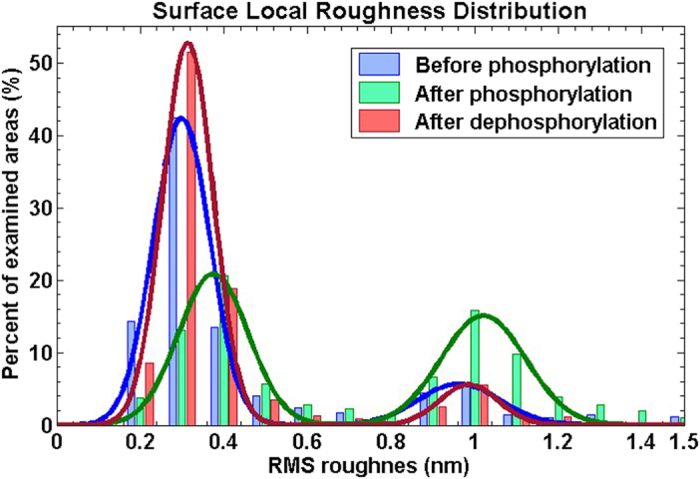
Figure 4. Surface local roughness distribution with a two-terms Gaussian fit.

The blue and red lines, representing the distributions of the local roughness before phosphorylation and after dephosphorylation, respectively, are very close, and different from the local roughness after phosphorylation (green). The phosphorylated state distribution is upshifted to higher roughness values and contains many higher roughness domains.
