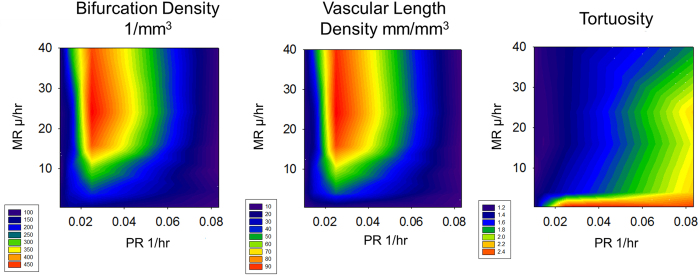
Figure 3. Contour Plots of Vascular Metrics at 20 Days.
We show a contour plot of the number of bifurcations per mm3, the vascular length density in mm/mm3 and tortuosity for different MR and PR. The number of bifurcations and the length density depend mostly on proliferation whereas tortuosity depends on both parameters.

