. 2016 Jul 4;3(4):235–244. doi: 10.1002/ehf2.12094
© 2016 The Authors. ESC Heart Failure published by John Wiley & Sons Ltd on behalf of the European Society of Cardiology.
This is an open access article under the terms of the Creative Commons Attribution‐NonCommercial‐NoDerivs License, which permits use and distribution in any medium, provided the original work is properly cited, the use is non‐commercial and no modifications or adaptations are made.
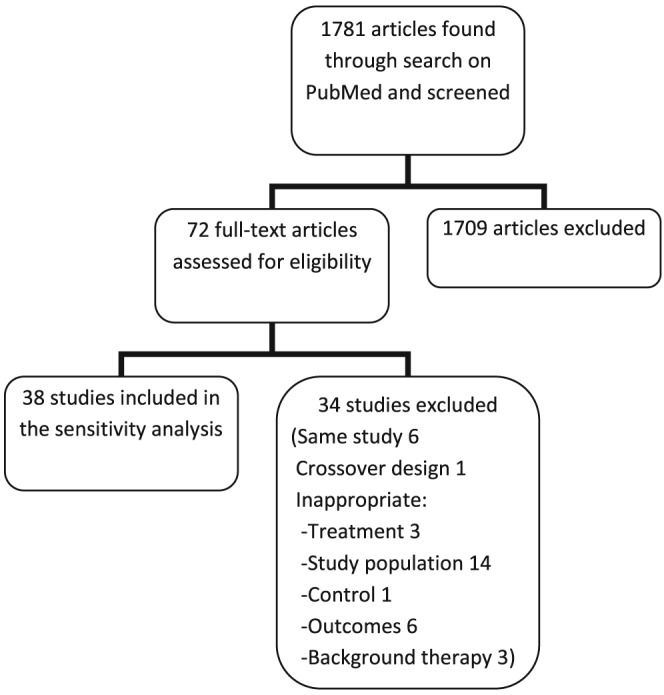
Figure 2.

Flowchart depicting the study selection for the sensitivity analysis.
