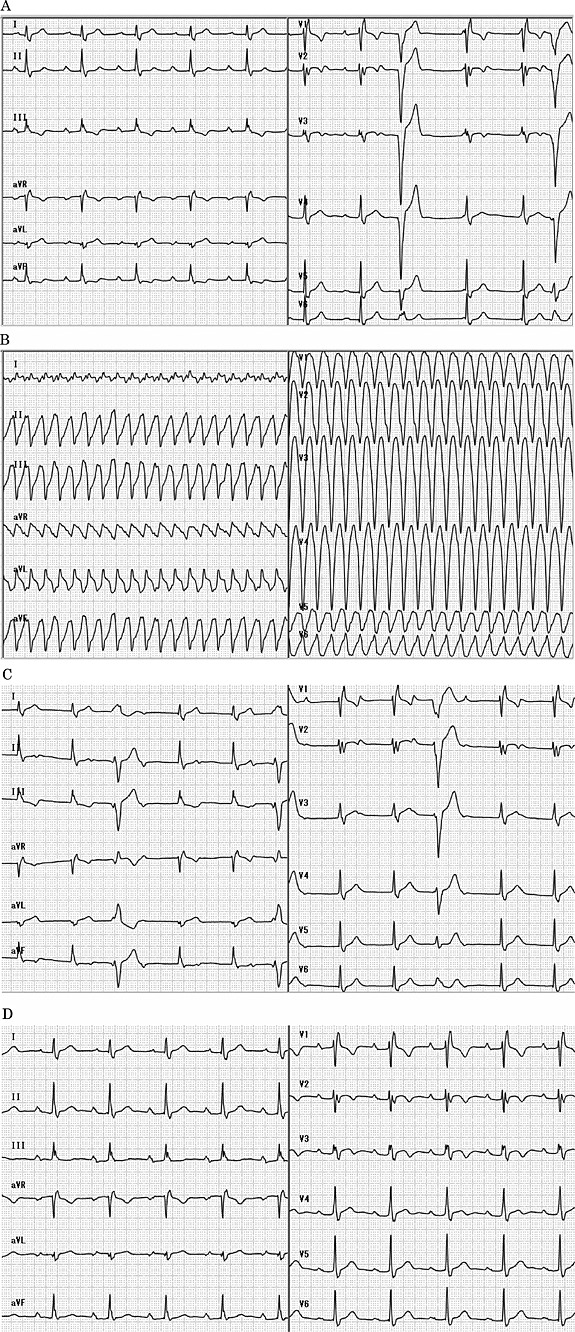
Figure 1.

Electrocardiogram. A is the initial electrocardiogram. It showed first‐degree atrioventricular block, complete right bundle branch block, and premature ventricular contractions. B is the electrocardiogram when he developed ventricular tachycardia. C is the electrocardiogram after defibrillation was successful with 200 J. It showed complete atrioventricular block. D is the electrocardiogram after being on steroid therapy for 2 weeks. It changed from previous complete atrioventricular block to first‐degree atrioventricular block and complete right bundle branch block.
