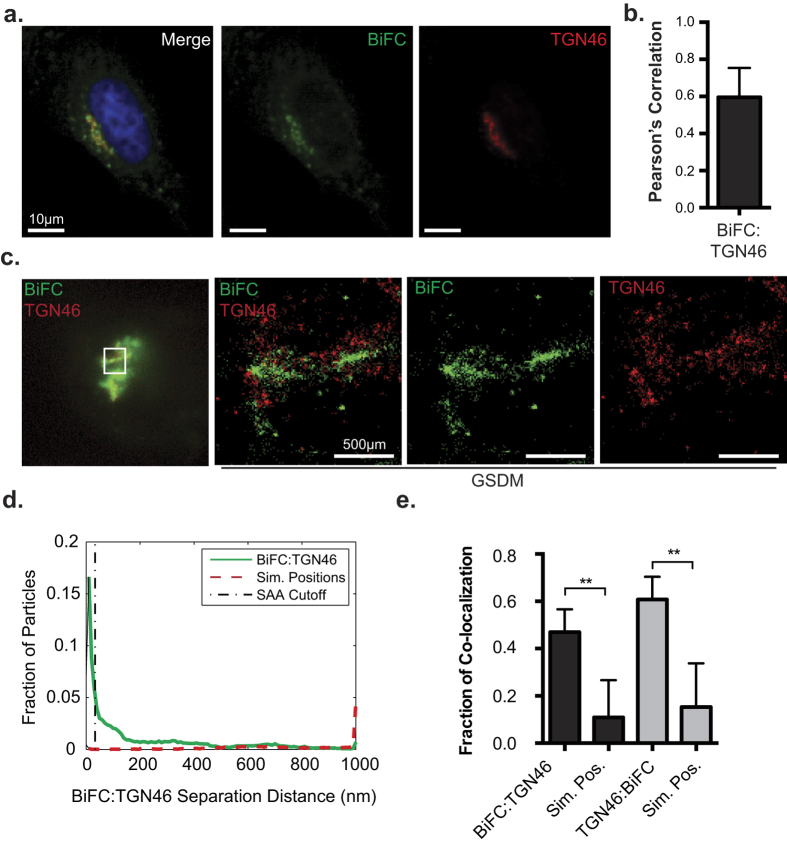
Figure 6. Nef targets MHC-I for sequestration within the trans-Golgi network.
(a) Nef-VC and MHC-I-VN-Flag were transfected into HeLa cells, and 24 hours later fixed and immunostained for TGN46. BiFC fluorescence (green) was observed under the FITC channel, and TGN46 (red) was observed under the Far-Red filters. (b) Co-localization was quantified by using the Pearson’s correlation through the JaCoP Plug-in on ImageJ. Error bars were calculated by quantification of at least 25 cells between 3 independent experiments. (*Indicates p-value < 0.05). (c) Cells were prepared as in (a) and imaged utilizing GSDM; scale bars represent 500 nm. (d) A histogram plotting the distance between the nearest neighbor, representing BiFC:TGN46 (Solid line) or BiFC:Simulated random positions (Sim. Positions; Dashed line). (e) A graphical representation of the fraction of co-localized particles observed in (d) which were observed to be under the cut-off value of ~40 nm. Error bars were calculated by quantification of 8 cells in 2 independent experiments (**indicates p-value < 0.01, ***indicates p-value < 0.001).

