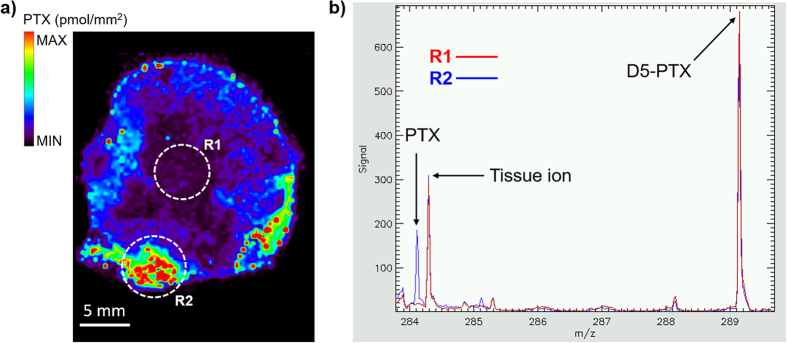
Figure 4. MALDI MSI of paclitaxel distribution inside treated tissue slice.
(a) Ion image of PTX fragment (m/z 284.2) normalized to the internal standard D5-PTX (m/z 289.2) that was homogenously sprayed all over the tissue sections. Two regions of interest (ROIs, R1 and R2) were drawn in two areas of the tissue with a significant difference of the PTX/D5-PTX signal. (b) Mean spectra of R1 and R2. PTX fragment peak intensity at m/z 284.2 significantly decreases in R1 while D5-PTX fragment at m/z 289.2 remains almost constant in R1 e R2.

