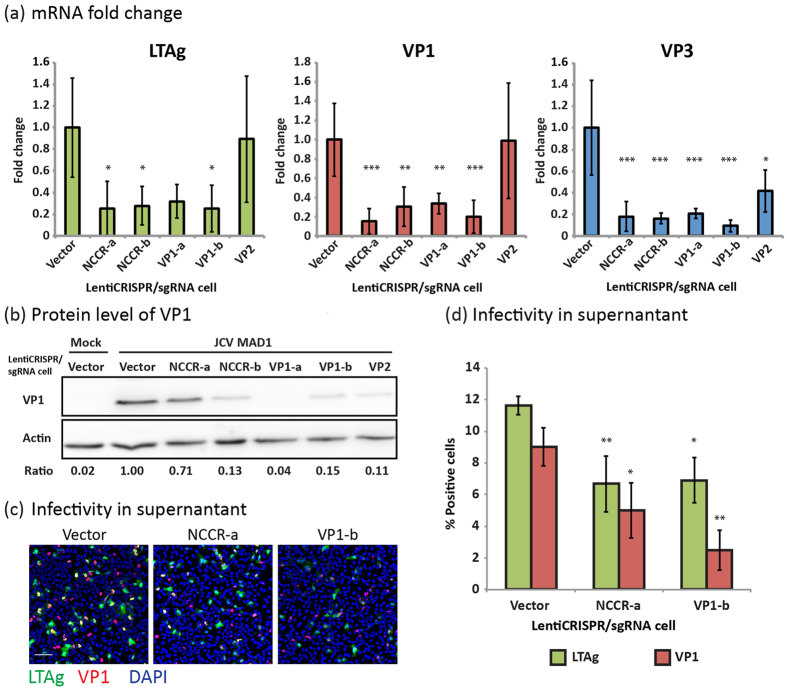
Figure 3. Expression of Cas9 and JCPyV specific gRNA inhibited productive JCPyV infection.
(a) Real-time PCR analysis showing the mRNA level of LTAg, VP1 and VP3 genes in different LentiCRISPR/gRNA stably expressing cells at day 3 post-infection. Fold changes of the mRNA is normalized to the vector control. *One-way ANOVA, p value < 0.05; **one-way ANOVA, p value < 0.01; ***one-way ANOVA, p value < 0.001. N=3 (b) Western blot analysis showing the level of VP1 in different LentiCRISPR/gRNA stably expressing cells at day 5 post-infection. Intensity Ratio between Actin and VP1 were measured using ImageJ and presented below the blots. (c,d) SVG-A cells were infected with supernatant collected from JCPyV-MAD1 infected LentiCRISPR/gRNA cells for 6 days. (c) Immunofluorescence images showing the expression of LTAg (green) and VP1 (red) in SVG-A cells and (d) the Quantification of the percentages of LTAg, VP1 positive SVG-A cells are shown. **One-way ANOVA, p value < 0.01.

